How many images are needed to load your website? Or JavaScript files? Or CSS files? Or font files?
How many bytes do those types of files consume?
You can find out by using Chrome’s Dev Tools. Before opening a webpage, right click in Chrome and click “Inspect”. Once the Dev Tools area opens, click “Network” in the top bar. (Note that this may be hidden from view and you’ll find Network by clicking “>>”.)
After opening up Network, load the webpage in Chrome. You will see all of the resources needed for your page to load listed in the Network area.
You can filter this list to specific resources. In the screenshot, I’m filtering to images. Now, you can see all of the images that were required to load this particular page.
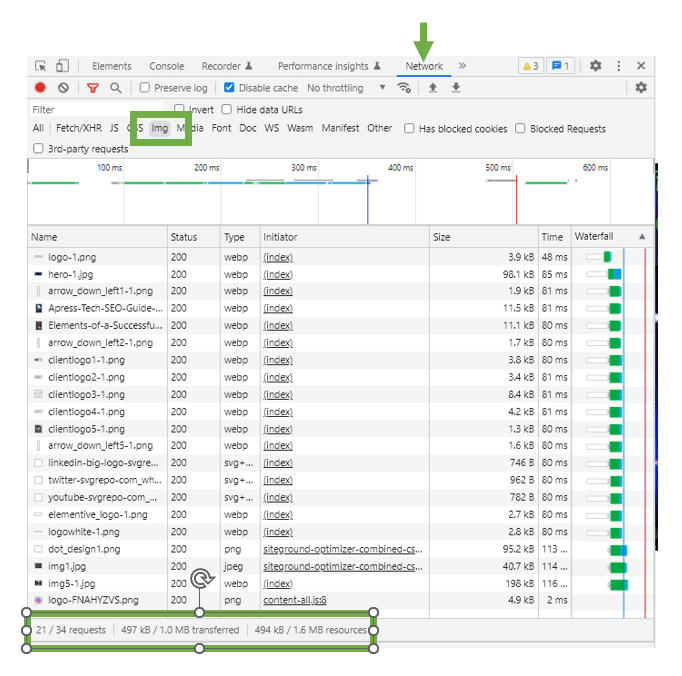
Down at the bottom, we can get detailed stats. For starters, we can see that 21 of the 34 files requested to load this page were images. That is nearly 2/3rds of the requested files!
Those images consumed 497KB of the total 1MB transfer size (the total size of your website sent from the server to the browser). That’s about half of the transfer size. That means, about half of the stuff the server sent to the browser was images.
The final number shows us the uncompressed size of this website. That is the size of the webpage after the browser has unpacked any compressed files. In this case, that uncompressed size is 1.6MB. That means images are only about a third of the total website’s size.
Looking at these numbers, optimizing images clearly would have an impact on improving this webpage’s speed.
You can toggle the filters at the top to review the same numbers for JavaScript, CSS, videos (media), font files, or other resource types you might be using. This is a helpful way to figure out which file type to focus on when optimizing your website’s speed.