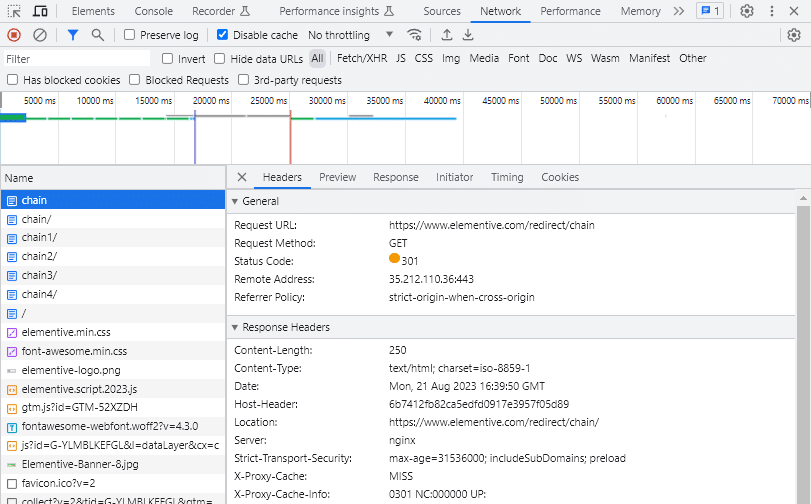
One of the best ways to understand redirects is by exploring redirects in Chrome DevTools. This is especially true for redirect chains. Here’s how to do this:
To evaluate redirects, you want to open up Chrome DevTools before loading the redirect. Right-click anywhere in Google Chrome and click Inspect and then click to Network in the top bar (click the “>>” icon to find Network if you don’t see it). Once Network is open, load the redirected URL.
Once the redirected URL loads, you will see something similar to the screenshot attached. This example shows a chain, where several URLs redirect from one to the next to the next. You can see the first redirected URL “chain” loads, followed by the next URL “chain/”, and the next and the next.
Click on the redirected URL to view details. In the “Headers” panel, you can see the status code returned. In this example, the redirect returns a 301 response. That is what we wanted! We can also see where the redirect goes with the Location response header.
The “timing” panel (not shown) will also show you how long the redirect takes to process and when the redirect started. This is a great way to evaluate how big of a problem the redirect might be presenting to your visitors.