
Google evaluates a website’s speed using three Core Web Vitals metrics. These metrics are one of many factors Google uses to determine where a website ranks in search results. When reviewing your website, it is important to measure Core Web Vitals and determine if your website meets the necessary thresholds. There are many tools available that will measure these metrics, including three free tools provided by Google: Google Search Console, PageSpeed Insights, and the CrUX Dashboard.
Google Search Console
Google Search Console provides an overview of the website’s Core Web Vitals performance. After opening your website in Google Search Console, click Core Web Vitals in the sidebar. This will take you to a dashboard showing how Core Web Vitals scores have trended over the last 3 months. The graphs provide a high-level summary of how many URLs are categorized as good, poor, or needs improvement on Mobile and Desktop devices.
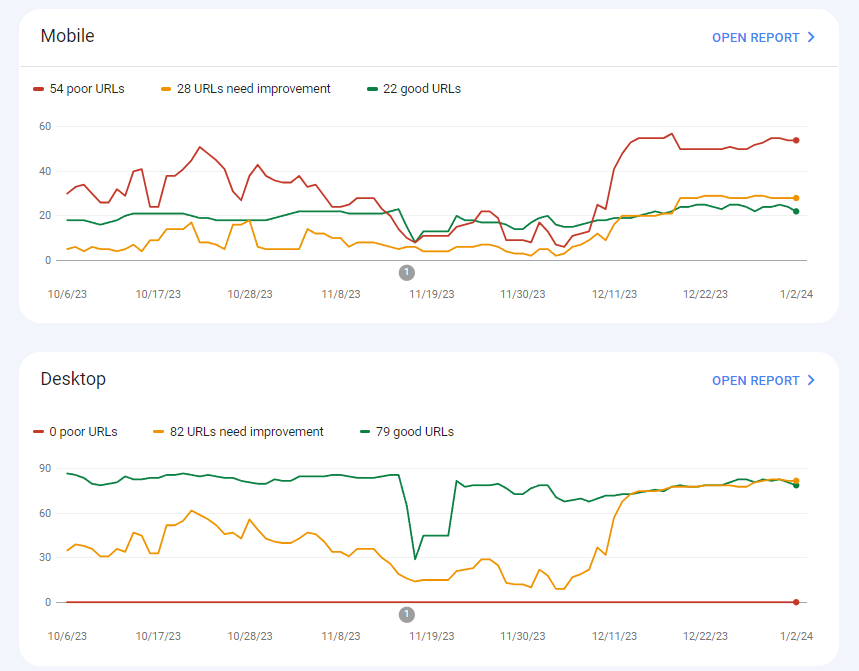
While these graphs are helpful, there are a few important things to note:
- These graphs are not a full assessment of the website’s speed or Core Web Vitals. For example, Google Search Console does not always show all URLs that meet Google’s Core Web Vitals thresholds (the good URLs). Even though good URLs might not be shown here, that does not mean there is a problem with the website’s speed.
- This is also not a real-time report. Instead, it is based on real-world visitors using the website in Google Chrome over the last 28 days. It may take time before recent changes are reflected in this report.
- Because the data shared in these graphs is from real-world visitors, there will be no data to share for websites with little to no traffic. Google needs enough traffic to the website so that there is enough data to assess the website’s Core Web Vitals.
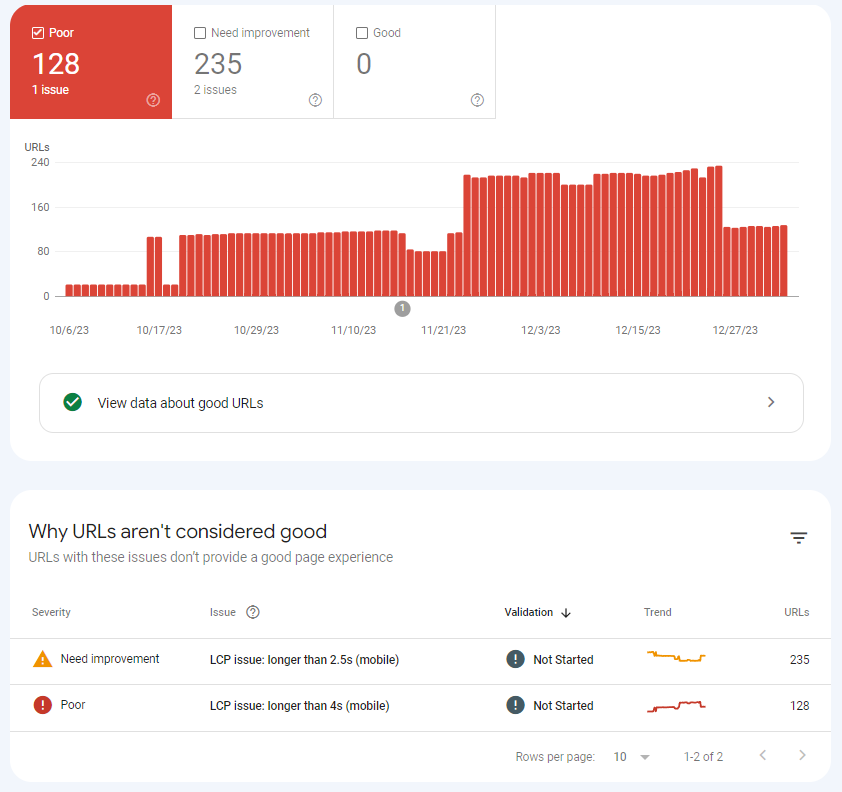
You can click the Open Report link in the graph for more details. This will show a table explaining “Why URLs Aren’t Considered Good”. In the following example, 235 pages are categorized as Needs Improvement and another 128 pages are categorized as Poor. In both cases, this is because of issues with Largest Contentful Paint.
Click on one of the rows in this table to see more details about that issue. This will open a report containing specific URLs that have this problem. The URLs are grouped by common page types of themes Google has detected. For example, here are the issues about the “Poor LCP” URLs:
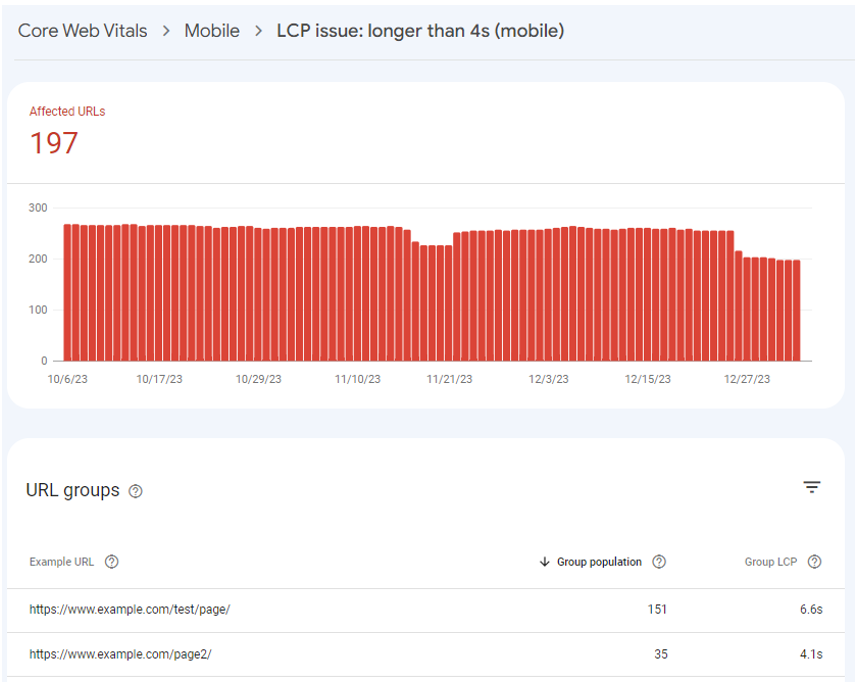
You can click on one of the rows in this table to expand a card containing more example URLs. Clicking in the first row of that table will provide a list of some of the 151 URLs in this group. To understand what is causing the issue, you can click the three vertical dots next to the URL and then select Developer Resources. This will analyze the URL in PageSpeed Insights.

PageSpeed Insights
PageSpeed Insights is a free tool provided by Google. You can access PageSpeed Insights through Google Search Console or by accessing the tool directly.
Once you arrive on the PageSpeed Insights main page, enter a URL to a page on your website, then click Analyze.

We’ll use Amazon as an example. Once you click the Analyze button, the test will run, and then you’ll see the results page, which will look something like this. Note that you can toggle between Mobile and Desktop results. The report will default to Mobile results.

Lab Data and Field Data
PageSpeed Insights provides two types of data: lab data and field data.
The first set of results shown is field data. This is under the header “Discover what your real users are experiencing” and is shown in the screenshot above. Field data is a historical look at real users and is based on visitors who came to the website in Google Chrome. It reports on how those visitors were able to load the website over the last 28 days. Because the field data comes from real users, this information is not available for a new page or pages with low traffic volumes.
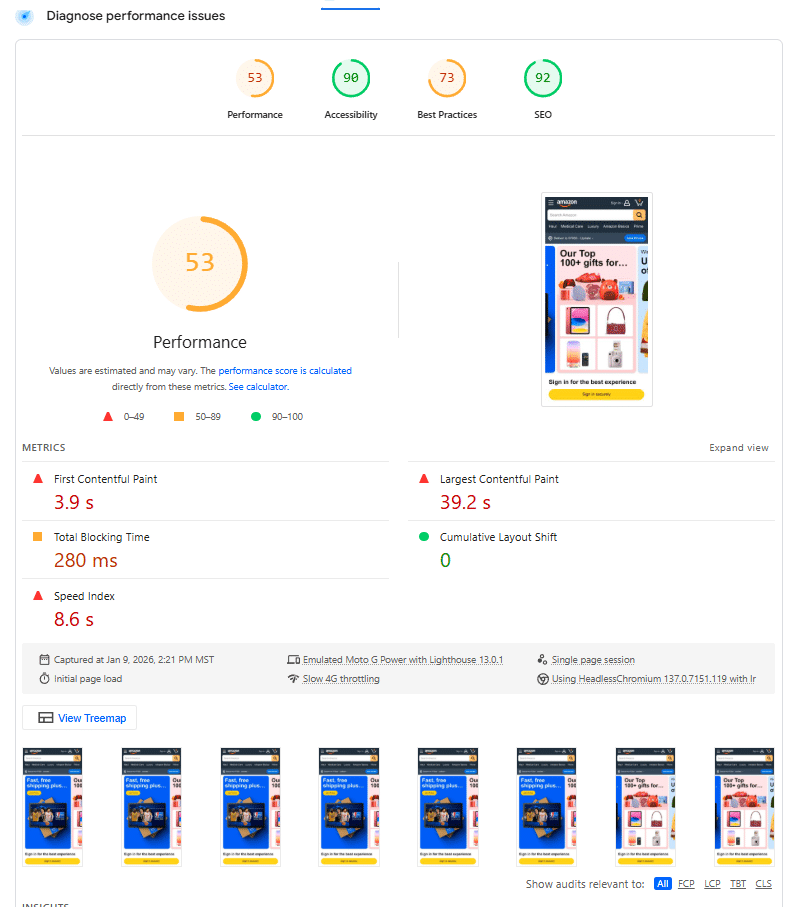
Next, PageSpeed Insights presents lab data. This is below the data about real users and under the header “Diagnosing performance issues.” This data comes from Lighthouse and provides a real-time analysis of how quickly the website loads.
The first piece of information presented in the lab data is a gauge showing the website’s performance score. In the example below, Amazon’s score is 52 on mobile devices. This is the Lighthouse Performance score and it is a weighted average of multiple speed metrics. It can be useful for a rough comparison between different pages. However, the more actionable approach is to compare specific metrics instead of the overall score.
Along with the Performance, the lab data shows various speed metrics, including LCP, CLS, and TBT (which is the proxy for INP). PageSpeed Insights also shows a timeline of how the page loaded, which can help diagnose any issues that might be present on the website.
Opportunities and Diagnostics
Scrolling down the page, Google provides opportunities and diagnostics. These sections provide ideas about how to improve the website’s speed. Although these recommendations are provided by Google’s tool, that does not mean that correcting these specific issues will help improve Google’s assessment of your website or that fixing these specific issues will directly improve your website’s ranking position in search results. Instead, these are ideas about how you may be able to improve your website’s speed. Helpfully, diagnostics and opportunities can be filtered by a particular metric by clicking on the links to the right of Opportunities (“Show audits relevant to”).

Chrome User Experience Data
Google provides a way to view details of the Chrome User Experience (CrUX) data. This is the data that is used to calculate Core Web Vitals metrics. This is the raw field data. That means, as with PageSpeed Insights and Google Search Console, this will only provide data for websites with sufficient traffic levels.
You can access this data with the free CrUX Vis tool. Once on this page, enter your website’s URL and then submit. This will open a collection of reports about the website’s speed and Core Web Vitals. The main report will show a summary of Core Web Vitals data, along with a graph showing how each Core Web Vitals metrics has trended.
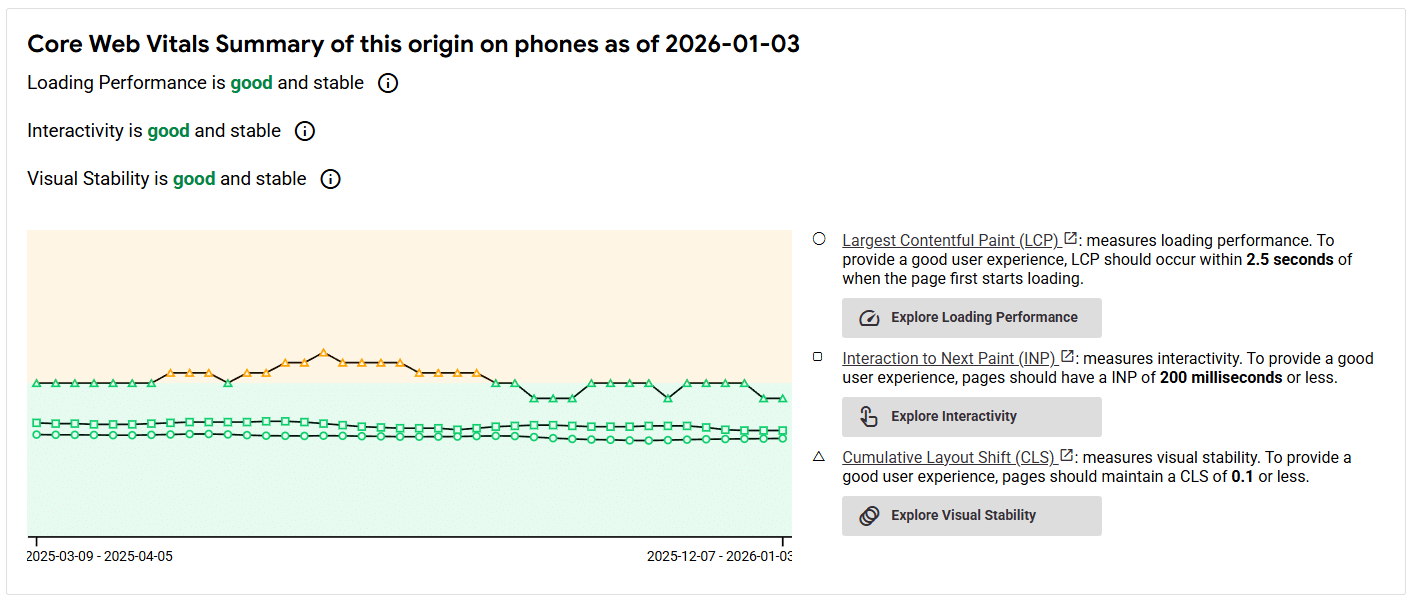
There are many other useful reports to review. I find the All Metrics report to be one of the more helpful because it gives you details about other speed metrics, beyond the three Core Web Vitals metrics. There are Controls available on each report that you can use to change the data that is included. In particular, the Controls can be useful to see the differences between Desktop and Mobile devices.
Need Help?
Remember that Core Web Vitals is only one aspect of your website’s speed. There are more metrics to improve and optimize to truly deliver a great user experience. If you need help measuring and improving Core Web Vitals or improving speed more broadly on your website, please contact me.
For more information about website speed, including more details about each of the Core Web Vitals metrics, check out my book Speed Metrics Guide.
More Articles
Schema Entity Mapping
Learn how to build an entity map, connect entities with schema markup and @id, and decide which information to repeat across your website.
Read Schema Entity Mapping →Schema: Find, Fix & Prevent Problems
Find and fix common schema markup problems, from invalid code to rendering issues. Learn how to audit and test schema with crawlers and validation tools.
Read Schema: Find, Fix & Prevent Problems →